AI Infographic Generator
Turn Text into Professional Infographics in Seconds — Easy & Fast
Transform your ideas, data, and stories into stunning, shareable infographics with our free AI tool. Just type a prompt like “startup growth timeline 2020-2025” or “benefits of remote work” — no design skills needed. Perfect for reports, social media, blogs, and presentations. Powered by nano-banana-pro.
100% online. Free credits on signup.
AI Infographics Created on Media.io — Powered by nano-banana-pro
Create AI Infographics in 3 Easy Steps
Turn your text, data, or story into a professional infographic using our free AI tool. No design skills, no software—just type and generate.
Go to the Free AI Infographic Generator
Visit the free AI infographic generator on Media.io. This tool turns simple text into polished, visual infographics—no sign-up required.
Type Your Prompt
Describe your infographic clearly. Use prompts like “Timeline of AI adoption from 2020 to 2025 with key milestones” or “Comparison of free vs paid AI infographic tools”. Add style cues like “minimalist”, “corporate blue”, or “colorful icons” for better results.
Generate & Download
Click Generate. Review your AI-created infographic, then download it instantly. Use it for blogs, LinkedIn posts, presentations, or client reports—ready in seconds.
| Infographic Type | AI Infographic Generator Prompts | Preview | Copy |
|---|---|---|---|
|
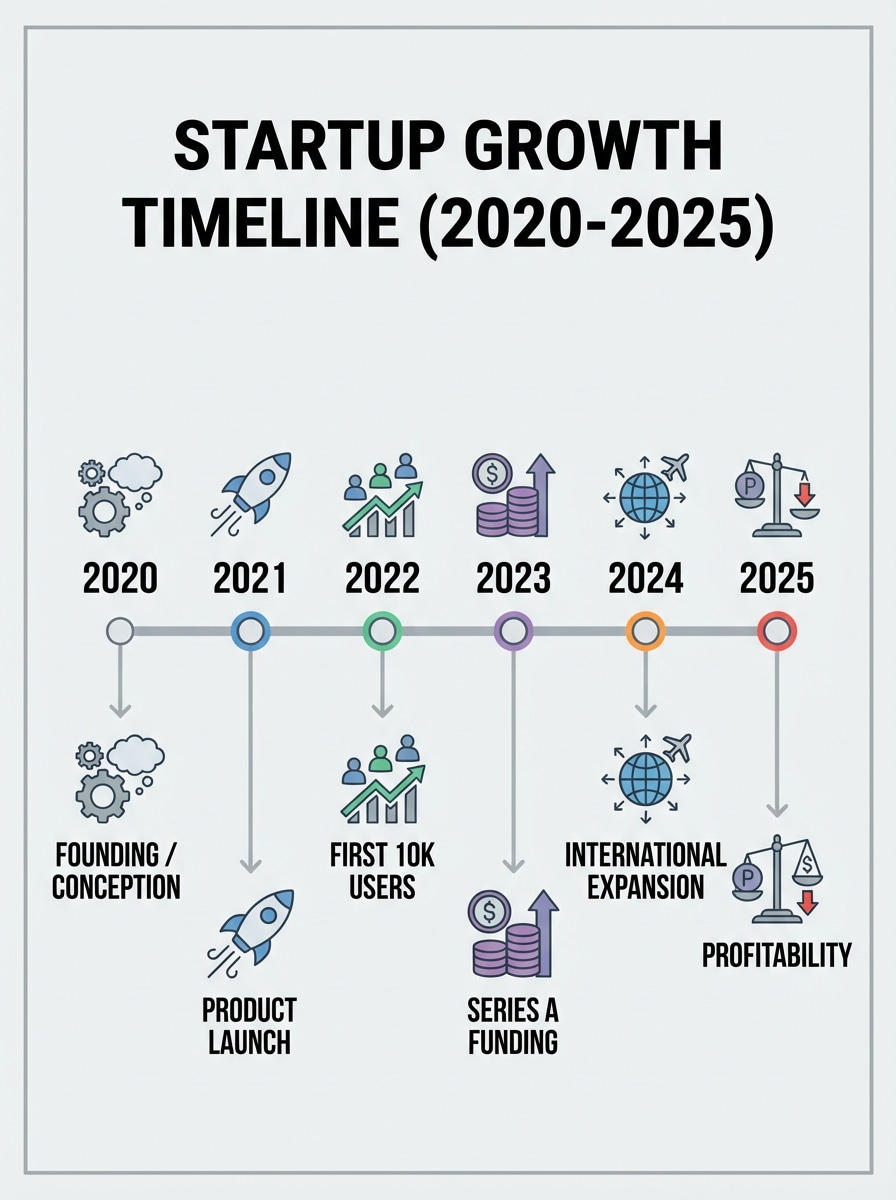
Startup Growth Timeline
#timeline
#startup
#business
|
Create a clean, minimalist startup growth timeline infographic covering the years 2020 to 2025. Include milestones: Product Launch (2021), First 10K Users (2022), Series A Funding (2023), International Expansion (2024), Profitability (2025). Use simple icons for each milestone, light gray background, and bold sans-serif text. Style: professional, corporate, infographic. |
|
|
|
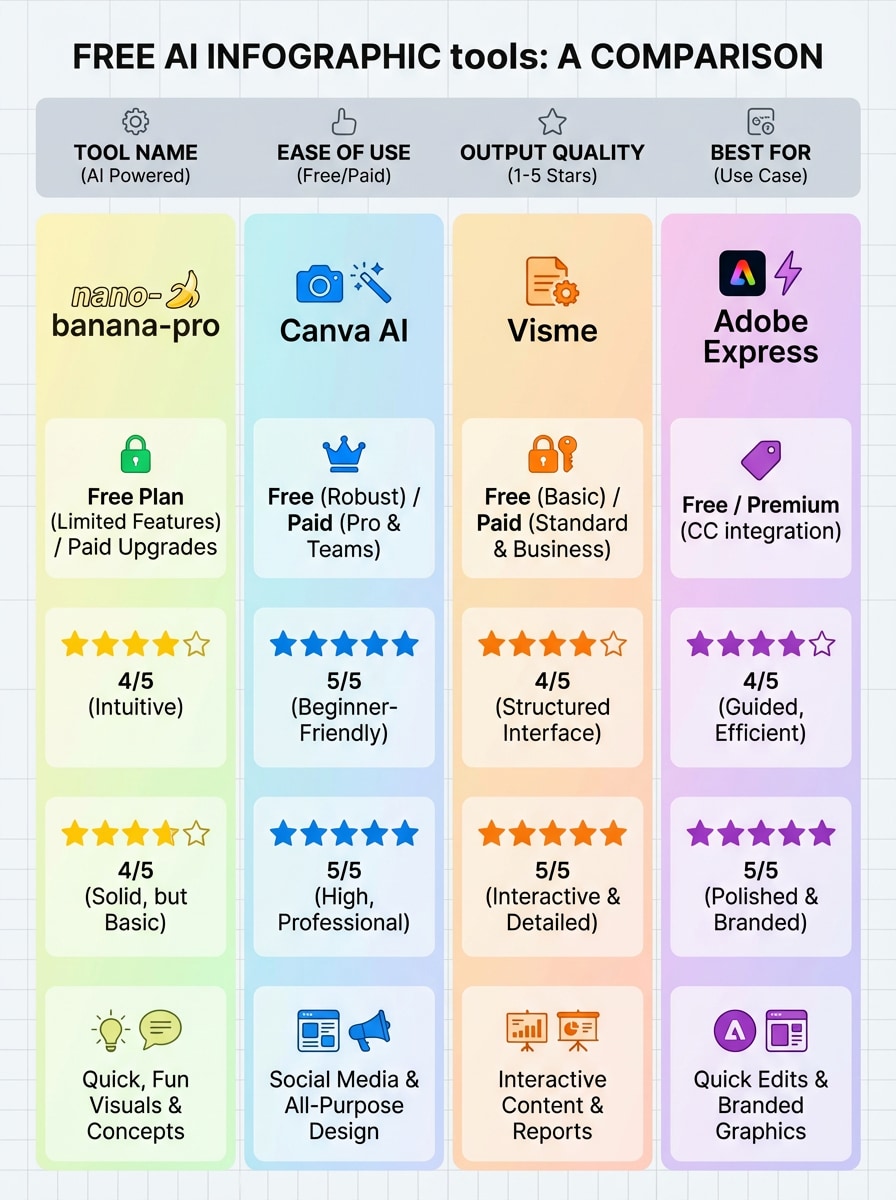
AI Tools Comparison
#comparison
#ai
#tools
|
Generate a comparison infographic for free AI infographic tools: nano-banana-pro, Canva AI, Visme, and Adobe Express. Use a 4-column layout. For each tool, show: Cost (Free/Paid), Ease of Use (1-5 stars), Output Quality (1-5 stars), Best For (e.g., “Social Media”, “Reports”). Use a clean, modern design with icons and subtle color coding. Style: infographic, flat design. |
|
|
|
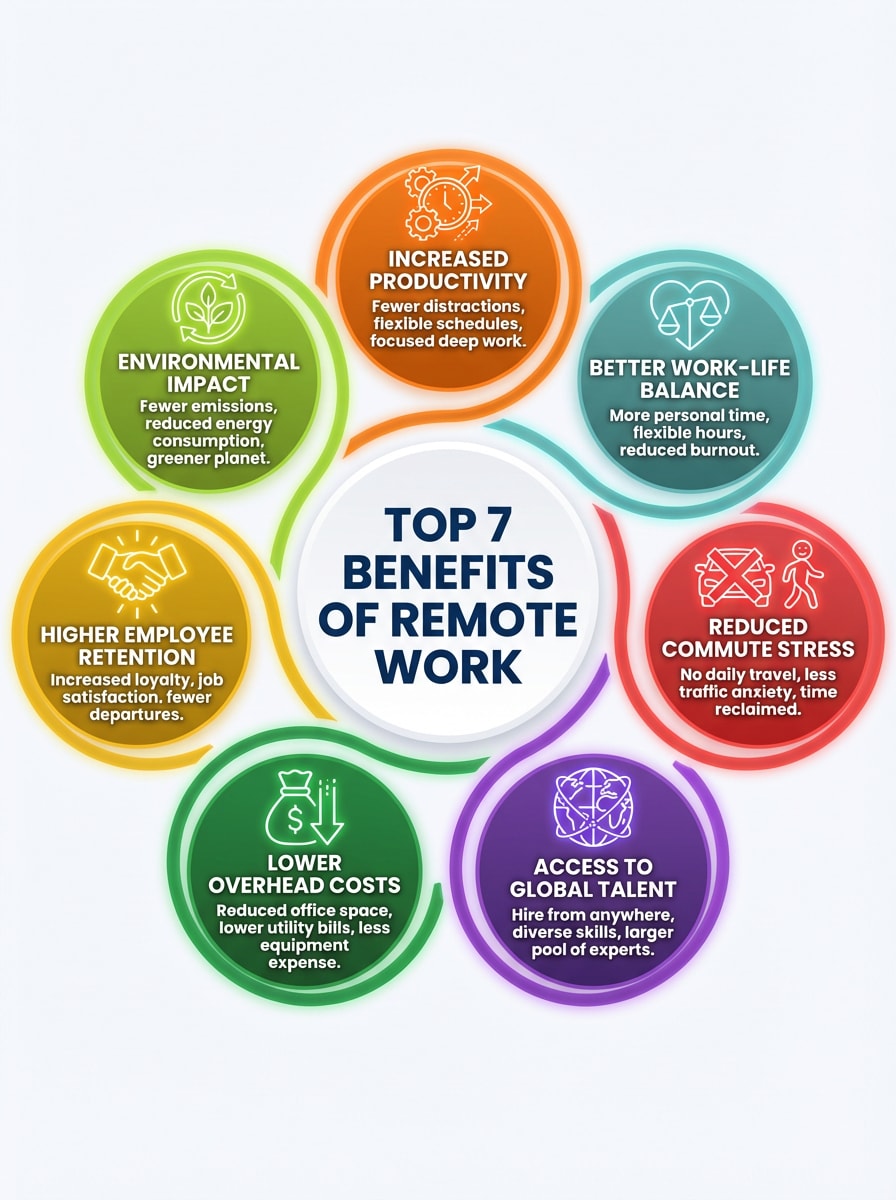
Benefits of Remote Work
#benefits
#remote
#work
|
Design a visual infographic listing the top 7 benefits of remote work: Increased Productivity, Better Work-Life Balance, Reduced Commute Stress, Access to Global Talent, Lower Overhead Costs, Higher Employee Retention, Environmental Impact. Use a circular layout with icons (e.g., clock, heart, car, globe, money bag, handshake, leaf). Background: soft white. Text: bold, readable. Style: infographic, vibrant colors, modern. |
|
|
|
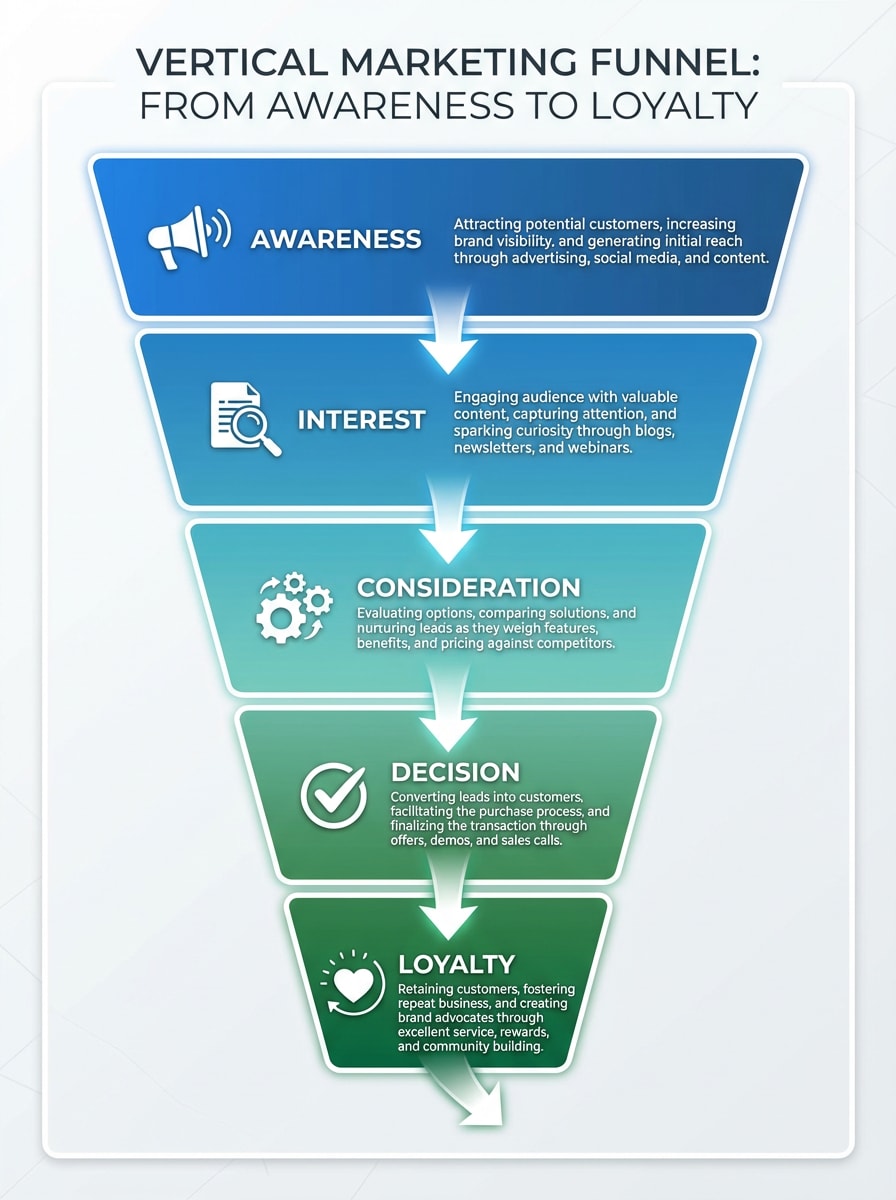
Marketing Funnel Process
#funnel
#marketing
#process
|
Create a vertical marketing funnel infographic with 5 stages: Awareness, Interest, Consideration, Decision, Loyalty. Use an inverted pyramid shape with arrows. For each stage, include a short description and a relevant icon (e.g., megaphone, magnifying glass, gears, checkmark, heart). Color scheme: gradient from blue to green. Style: professional, business infographic, clean lines. |
|
|
|
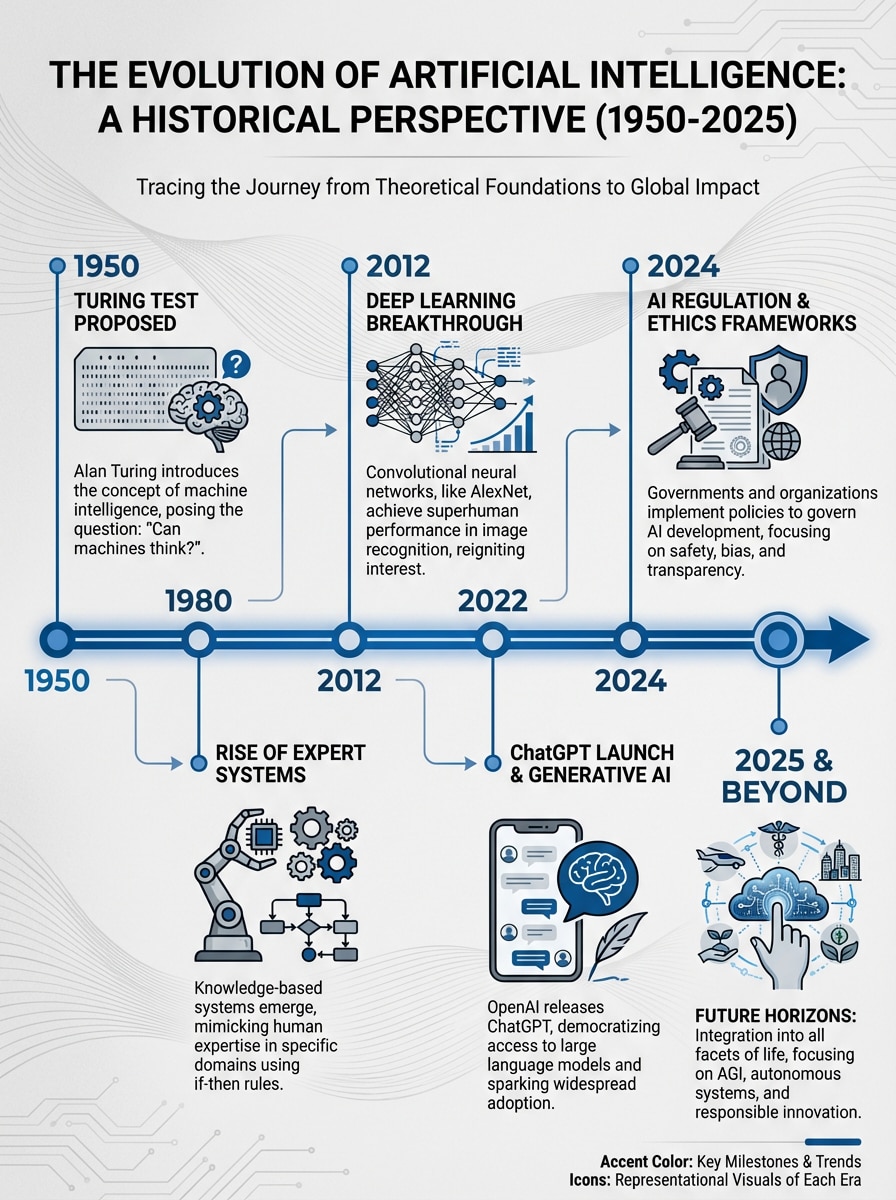
History of AI Development
#history
#ai
#timeline
|
Generate a historical timeline infographic tracing the evolution of artificial intelligence from 1950 to 2025. Key events: Turing Test (1950), Expert Systems (1980), Deep Learning (2012), ChatGPT Launch (2022), AI Regulation (2024). Use a horizontal line with vertical markers. Include small icons for each era (e.g., punch card, robot, neural network). Background: grayscale with one accent color. Style: educational, academic, clean. |
|
|
|
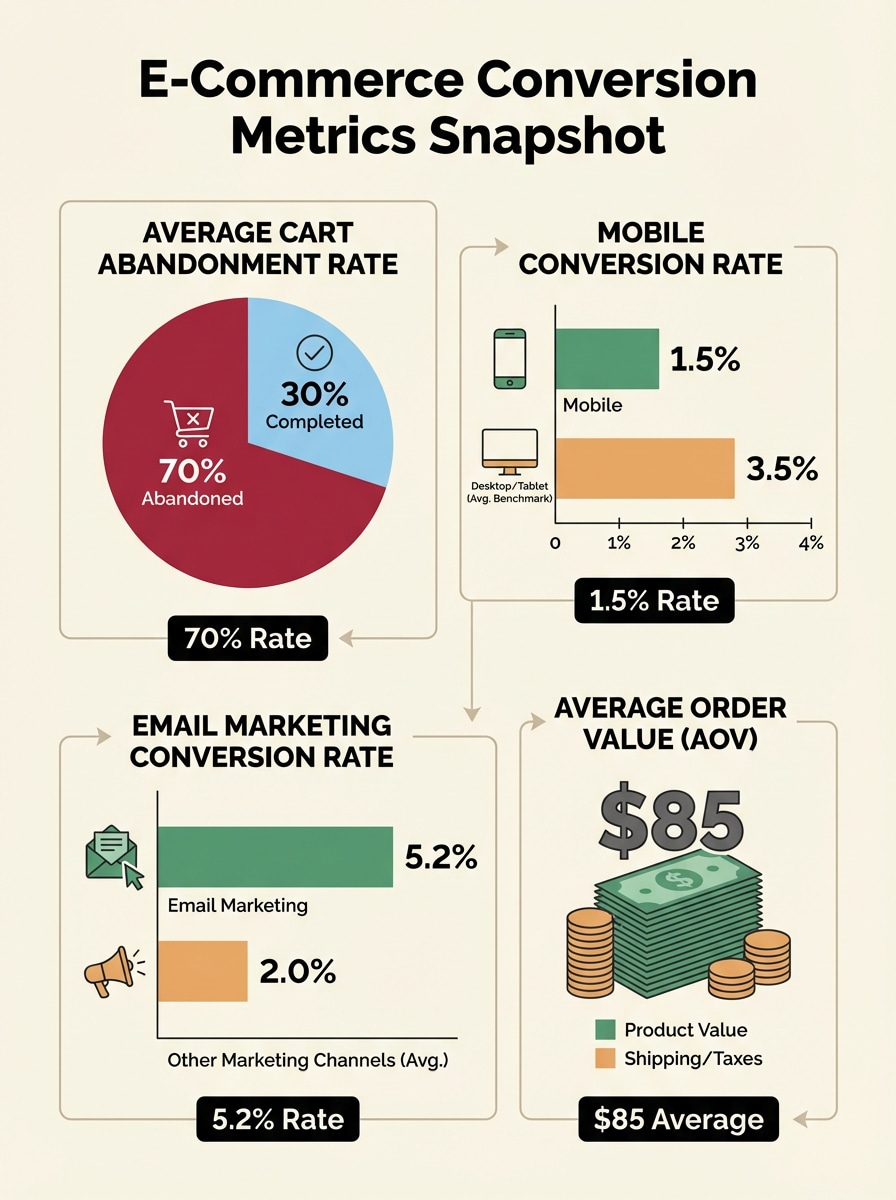
E-commerce Conversion Stats
#stats
#ecommerce
#data
|
Create a statistical infographic showing key e-commerce conversion metrics: Average cart abandonment rate (70%), Mobile conversion rate (1.5%), Email marketing conversion rate (5.2%), Average order value ($85). Use bar charts and pie charts with bold labels. Background: light cream. Text: dark gray. Style: data visualization, infographic, clean and professional. |
|
|
|
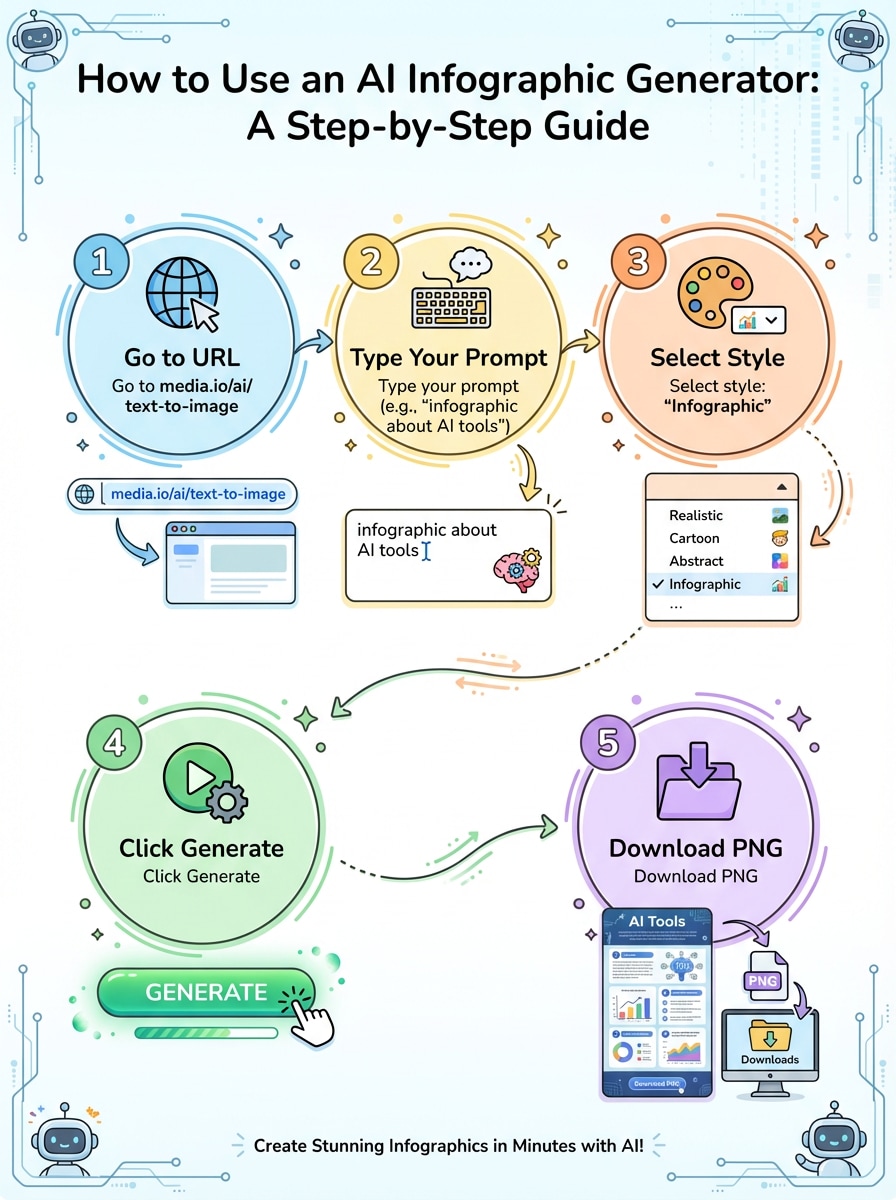
How to Use AI Infographic Tools
#tutorial
#guide
#infographic
|
Design a step-by-step tutorial infographic on how to use an AI infographic generator: 1. Go to media.io/ai/text-to-image, 2. Type your prompt (e.g., “infographic about AI tools”), 3. Select style: “Infographic”, 4. Click Generate, 5. Download PNG. Use numbered circles with simple icons. Style: friendly, instructional, colorful but not cluttered. |
|
|
|
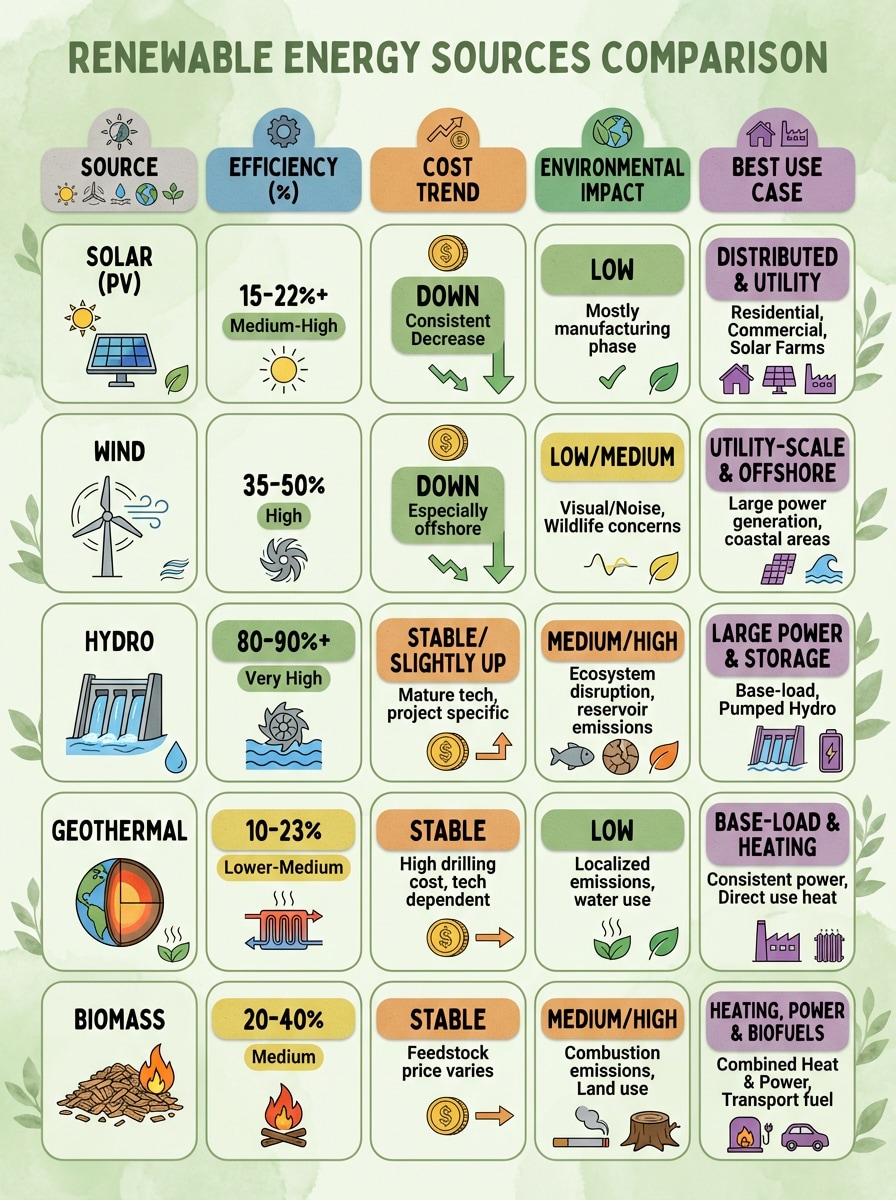
Sustainable Energy Sources
#sustainability
#energy
#environment
|
Create an educational infographic comparing 5 renewable energy sources: Solar, Wind, Hydro, Geothermal, Biomass. For each, show: Efficiency (%), Cost Trend (Up/Down), Environmental Impact (Low/Medium/High), and Best Use Case. Use a grid layout with icons and color-coded tags. Background: soft green. Style: eco-friendly, clean, infographic. |
|