
Turn Numbers into a Data Story
Move beyond rows and cells by organizing spreadsheet information around trends, comparisons, milestones, and conclusions viewers can follow.
 Seedance 2.5
Turn Excel spreadsheets into video content that is easier to present, explain, and share. Media.io helps you use spreadsheet data, tables, trends, and key takeaways as source material for a more watchable video story instead of leaving important insights inside rows and columns.
Start from the spreadsheet you already have.
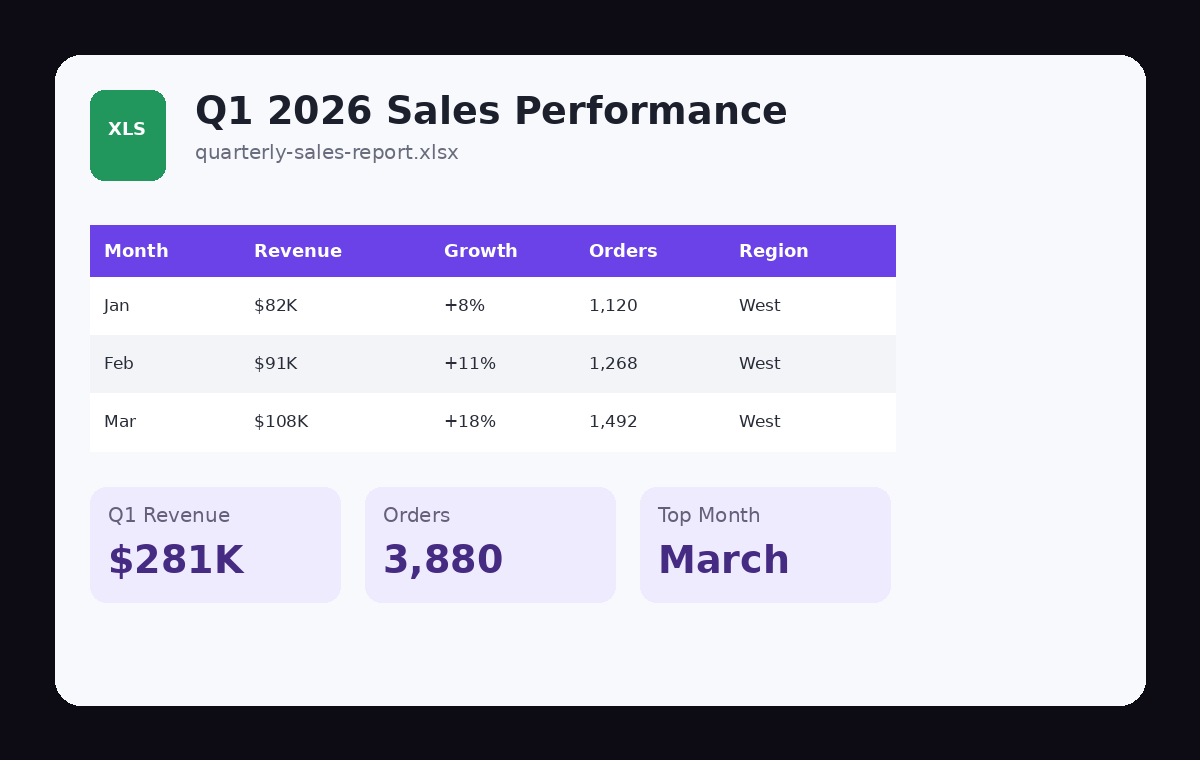
An Excel to video AI generator uses spreadsheet content as the source for a video. Instead of presenting viewers with raw rows, columns, tables, and charts, the workflow helps reorganize the information around the metrics, trends, comparisons, or conclusions that matter most. The result is easier to watch and communicate than a spreadsheet alone.
Jump to the workflow that best matches what you want to create.
Spreadsheets are excellent for storing and calculating data. Video is better when the goal is to explain what the data means, show how it changed, and help an audience understand the takeaway quickly.
Move beyond rows and cells by organizing spreadsheet information around trends, comparisons, milestones, and conclusions viewers can follow.
Use the spreadsheet as source material, then center the video around the business question, result, or message your audience actually needs.
Repurpose sales trackers, KPI reports, research sheets, and operational summaries into video updates without recreating the source data from scratch.
Create a more watchable format for meetings, executive updates, training, stakeholder communication, and other situations where a spreadsheet alone is too dense.
Excel to video works best when the spreadsheet already contains a meaningful result, trend, comparison, or update that needs to be communicated to people who do not want to inspect the workbook themselves.
Convert sales trackers, revenue tables, pipeline summaries, order data, and regional performance sheets into a video recap built around the results that matter.
A spreadsheet to video workflow is useful for monthly sales reviews, quarterly updates, growth recaps, territory comparisons, and stakeholder presentations. Instead of walking through cell after cell, the video can focus attention on changes, milestones, and the strongest or weakest areas.
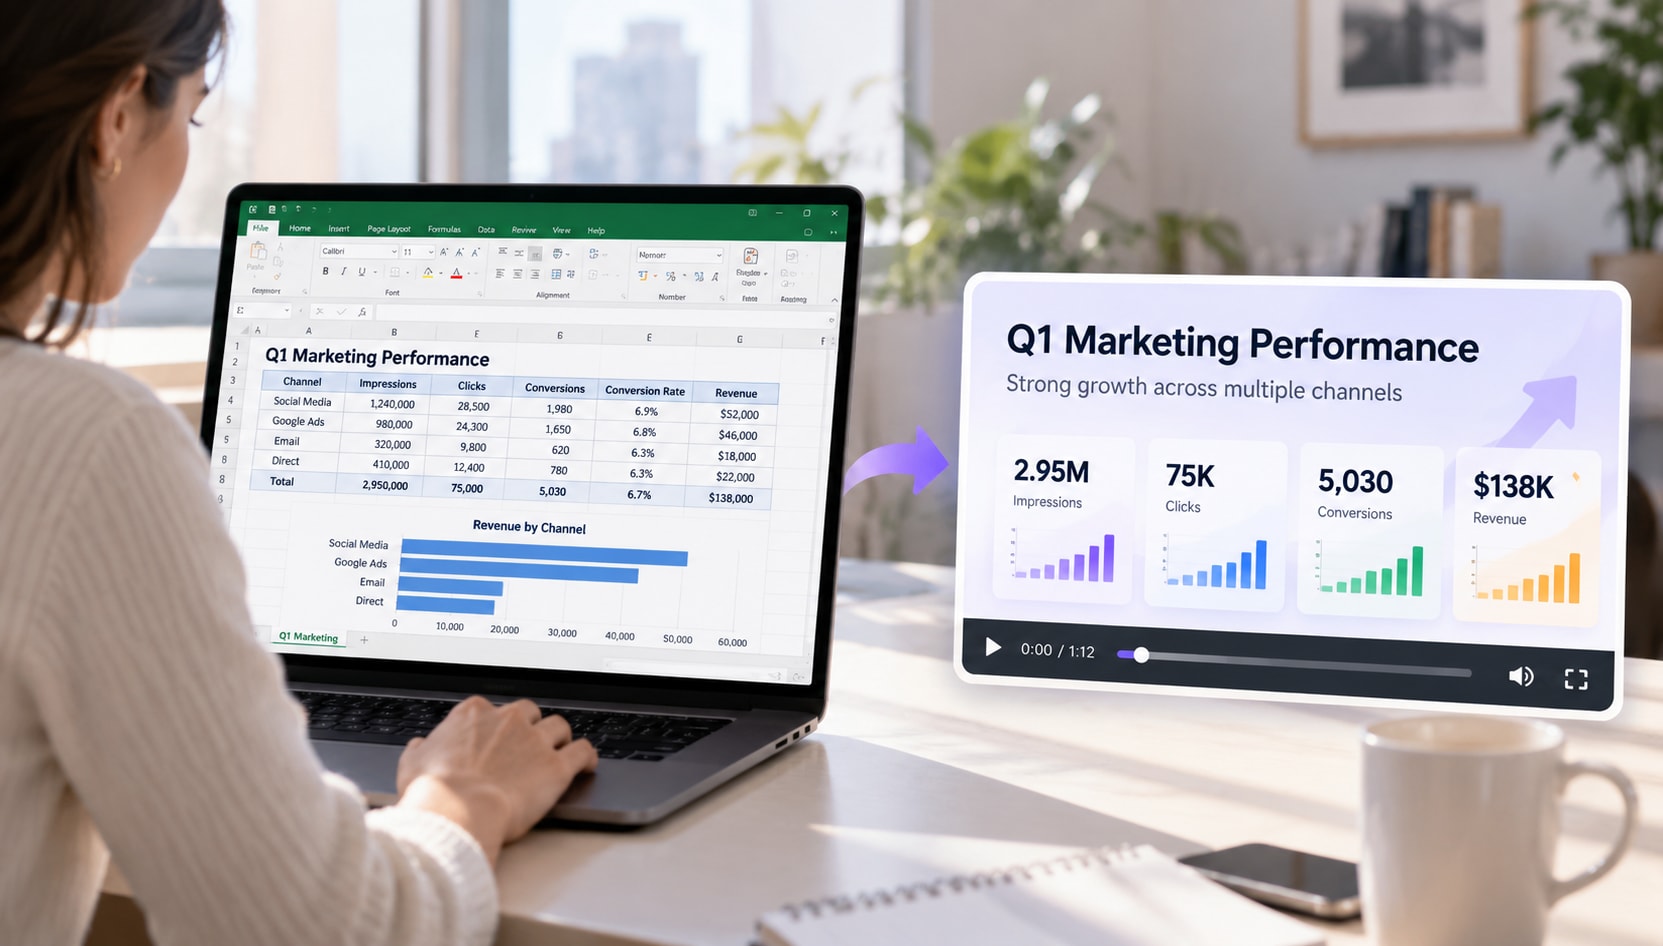
Turn key performance indicators, operational metrics, growth dashboards, and weekly business trackers into short video updates for teams and decision-makers.
This data to video use case is strongest when viewers need the conclusion more than they need the full spreadsheet. Highlight the metric that changed, explain why it matters, and give the audience the next action or question to consider.
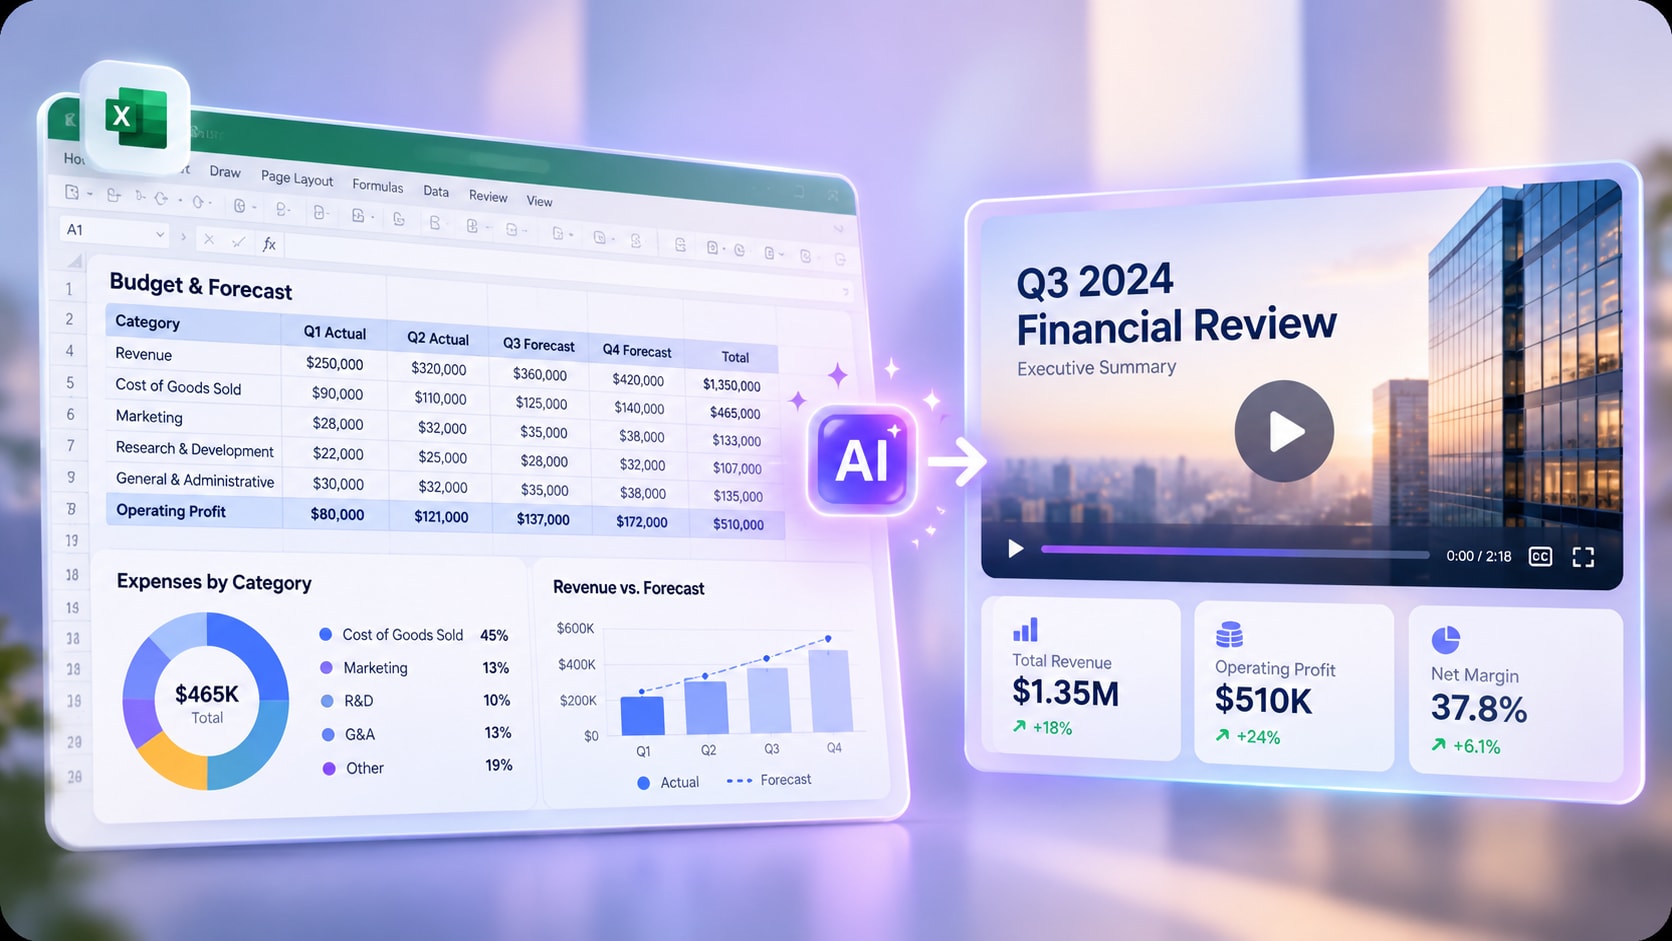
Use budget sheets, financial summaries, quarterly reports, forecasts, expense tables, and executive workbooks as the basis for a more watchable business presentation.
An Excel to video converter can help communicate the key movement behind the numbers, but financial figures still require careful review. Verify totals, percentages, currency, units, and time periods against the original spreadsheet before sharing the final video.
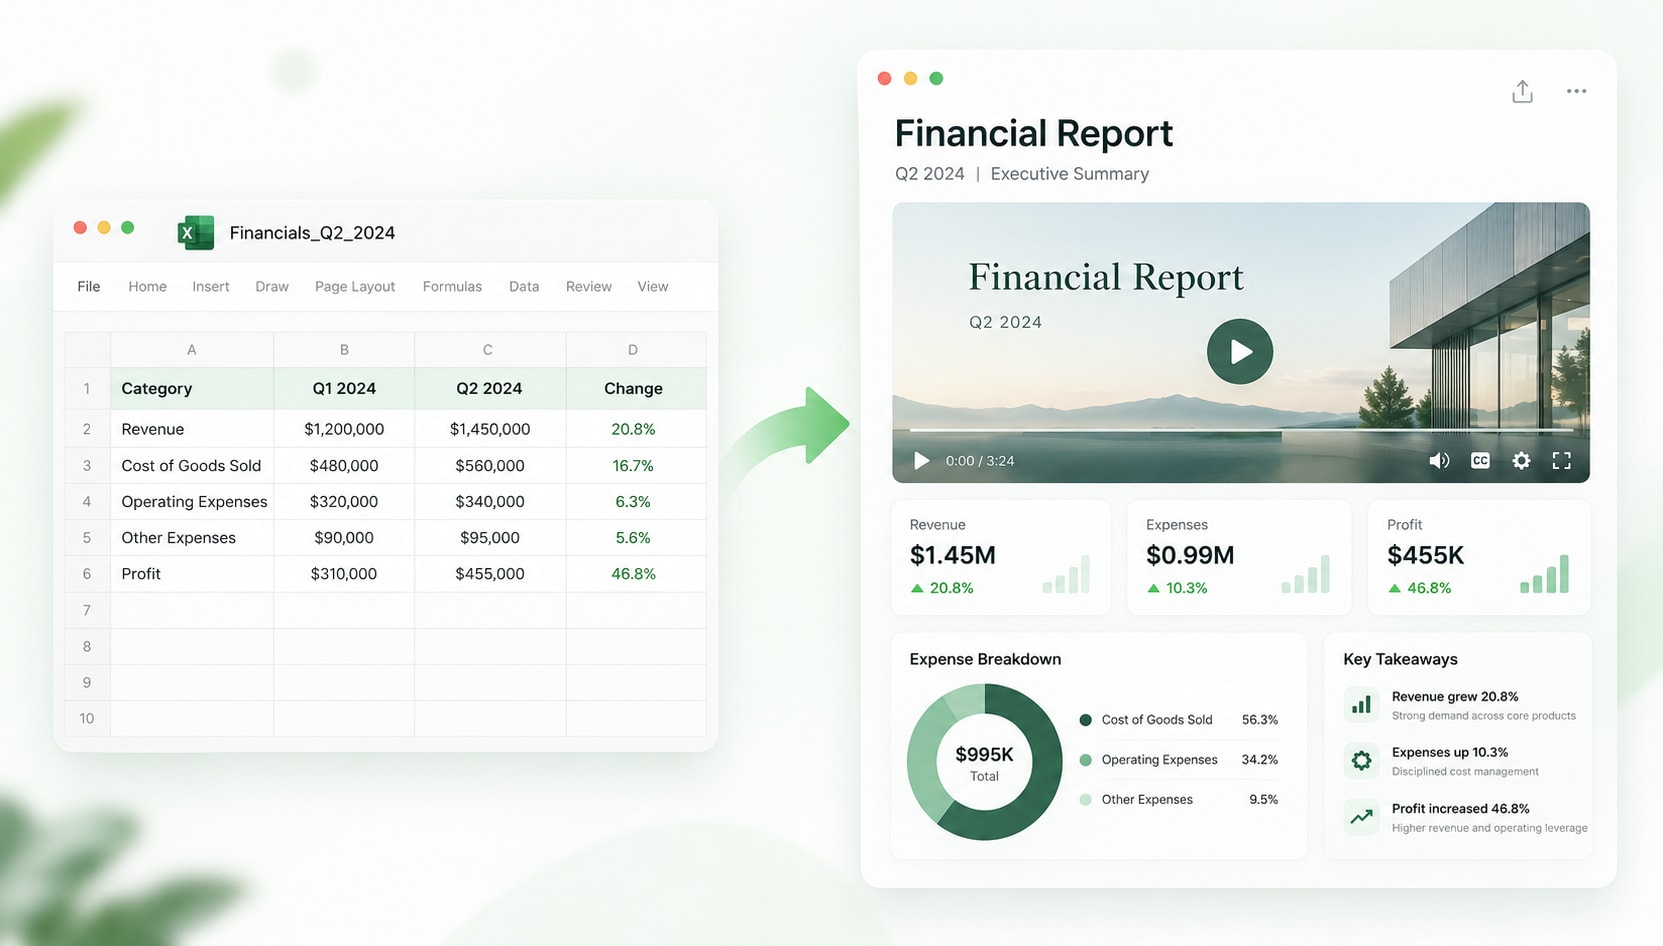
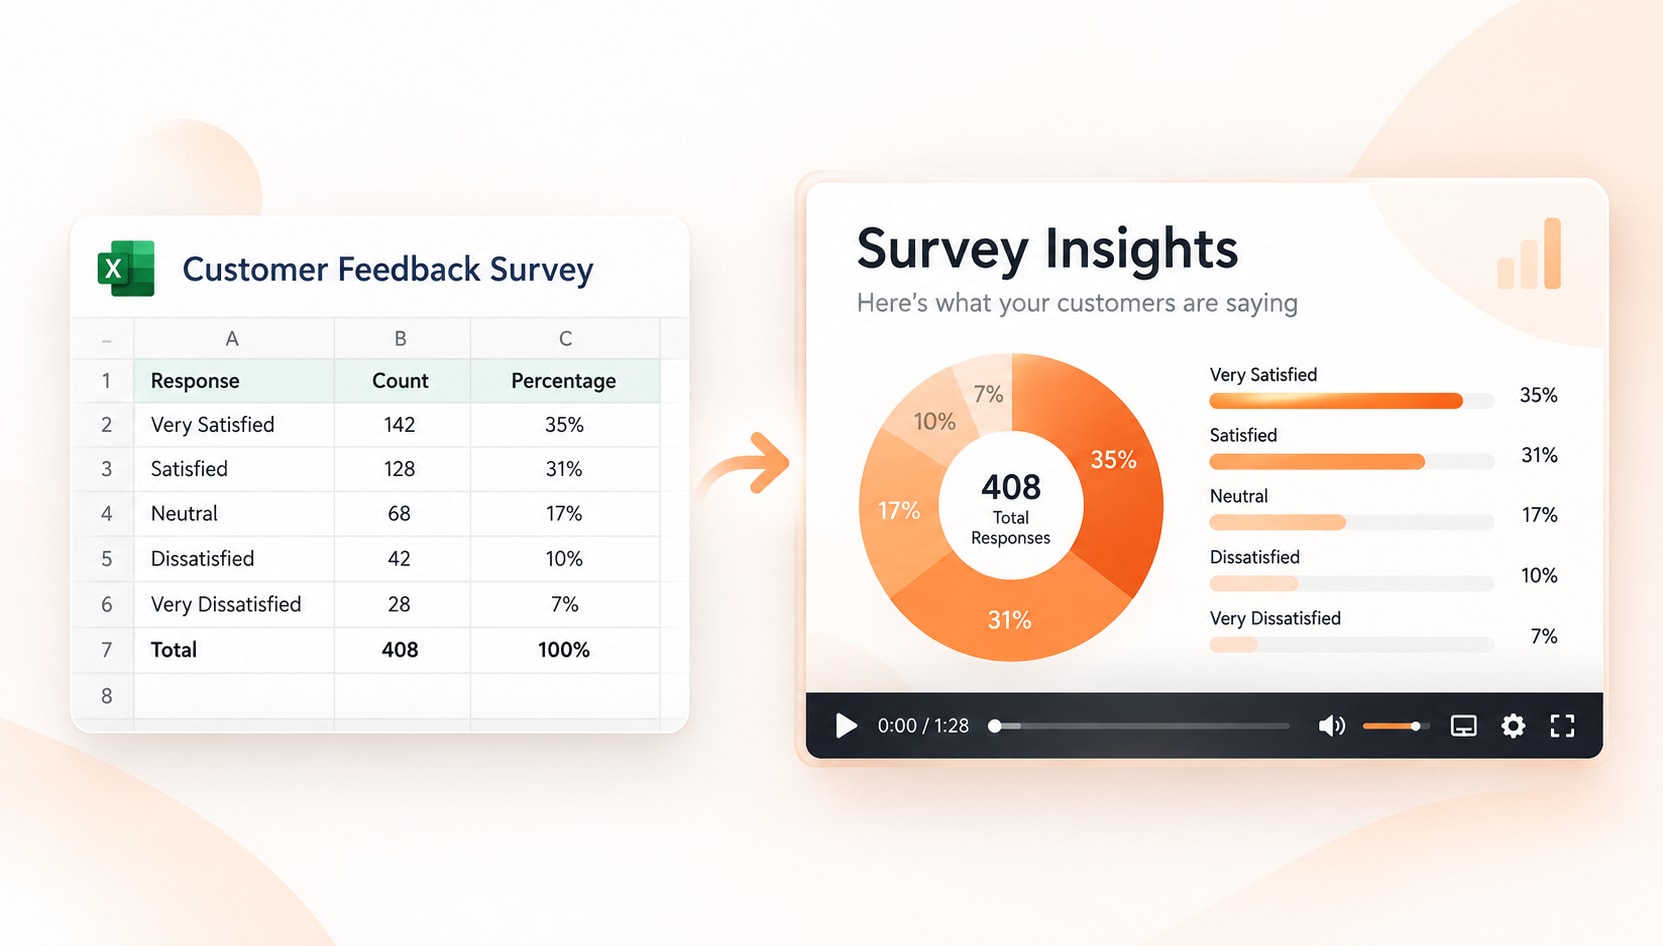
Convert survey responses, research tables, benchmark results, experiment summaries, and analysis sheets into a video that focuses on findings rather than raw rows.
A spreadsheet to video AI workflow can help make complex findings more approachable for clients, classrooms, internal teams, or social audiences. Keep the final story narrow enough that each visual supports one clear conclusion.
Start with the spreadsheet that contains the data you want to explain. Clear headers, consistent values, and a focused workbook make the source easier to interpret.
Tell the AI what the audience should understand. Focus on the most important trend, comparison, result, metric, or decision rather than trying to show every spreadsheet cell.
Review the video against the workbook. Verify numbers, labels, dates, units, percentages, and conclusions before using the final result in a presentation or publishing workflow.
The strongest source spreadsheet makes its meaning easy to identify. A workbook does not need to be simple, but the video should have a clear question, audience, and takeaway.
Treat the generated video as a new presentation of the spreadsheet, not a frame-by-frame recording of the workbook.
Video can simplify a spreadsheet, but simplification should never change the underlying facts.
Check totals, percentages, averages, growth rates, and any number the video highlights.
A value can become misleading if the currency, date range, percentage basis, or measurement unit is missing.
Make it clear when the spreadsheet shows a measured result and when the video is drawing a conclusion or recommendation from it.
These two workflows solve different problems. Choose the format based on what viewers need to understand.
Uses spreadsheet information as source material and reorganizes the most useful figures, trends, and conclusions into a video-friendly structure.
Records the spreadsheet interface while someone scrolls, clicks, filters, edits, or demonstrates how the workbook works.
An Excel to video converter uses spreadsheet information as the starting point for video content. Instead of showing viewers a raw workbook, the goal is to turn important metrics, trends, comparisons, and takeaways into a more watchable presentation.
Yes. An AI Excel to video workflow can use spreadsheet data as source material and reorganize it into a video-focused narrative. For best results, give the video one clear question or takeaway and review every important figure against the original spreadsheet.
Excel to video describes the source format: the content begins in an Excel spreadsheet. Data to video is broader and can describe any workflow that turns structured data, metrics, charts, or analysis into a video presentation.
Yes. Sales performance, KPI dashboards, financial summaries, operational reports, and research results are strong use cases because the spreadsheet already contains measurable findings that can be organized around a clear video story.
Excel to MP4 usually describes the user's goal of turning spreadsheet content into a standard video experience. The useful distinction is whether the tool simply records the workbook or uses the spreadsheet as source material to create a new video presentation.
Not always. Spreadsheet to video can mean turning the workbook itself into one data-driven video. Some tools also use one spreadsheet row to generate one separate video in bulk. This page focuses on turning spreadsheet content into a video story rather than assuming every row becomes a separate output.
Use clear headers, consistent units, logical tables, and a focused topic. Before generation, decide which metrics or findings the audience actually needs. After generation, verify all figures and conclusions against the original workbook.
It depends on the goal. Use a screen recording when you need to teach viewers how to use the workbook. Use Excel to video when the audience needs the insight, result, or story behind the spreadsheet rather than the spreadsheet interface itself.